Project
Fabric F64 — Power BI, reimagined as a Commodore 64
- Rayfin
- Fabric
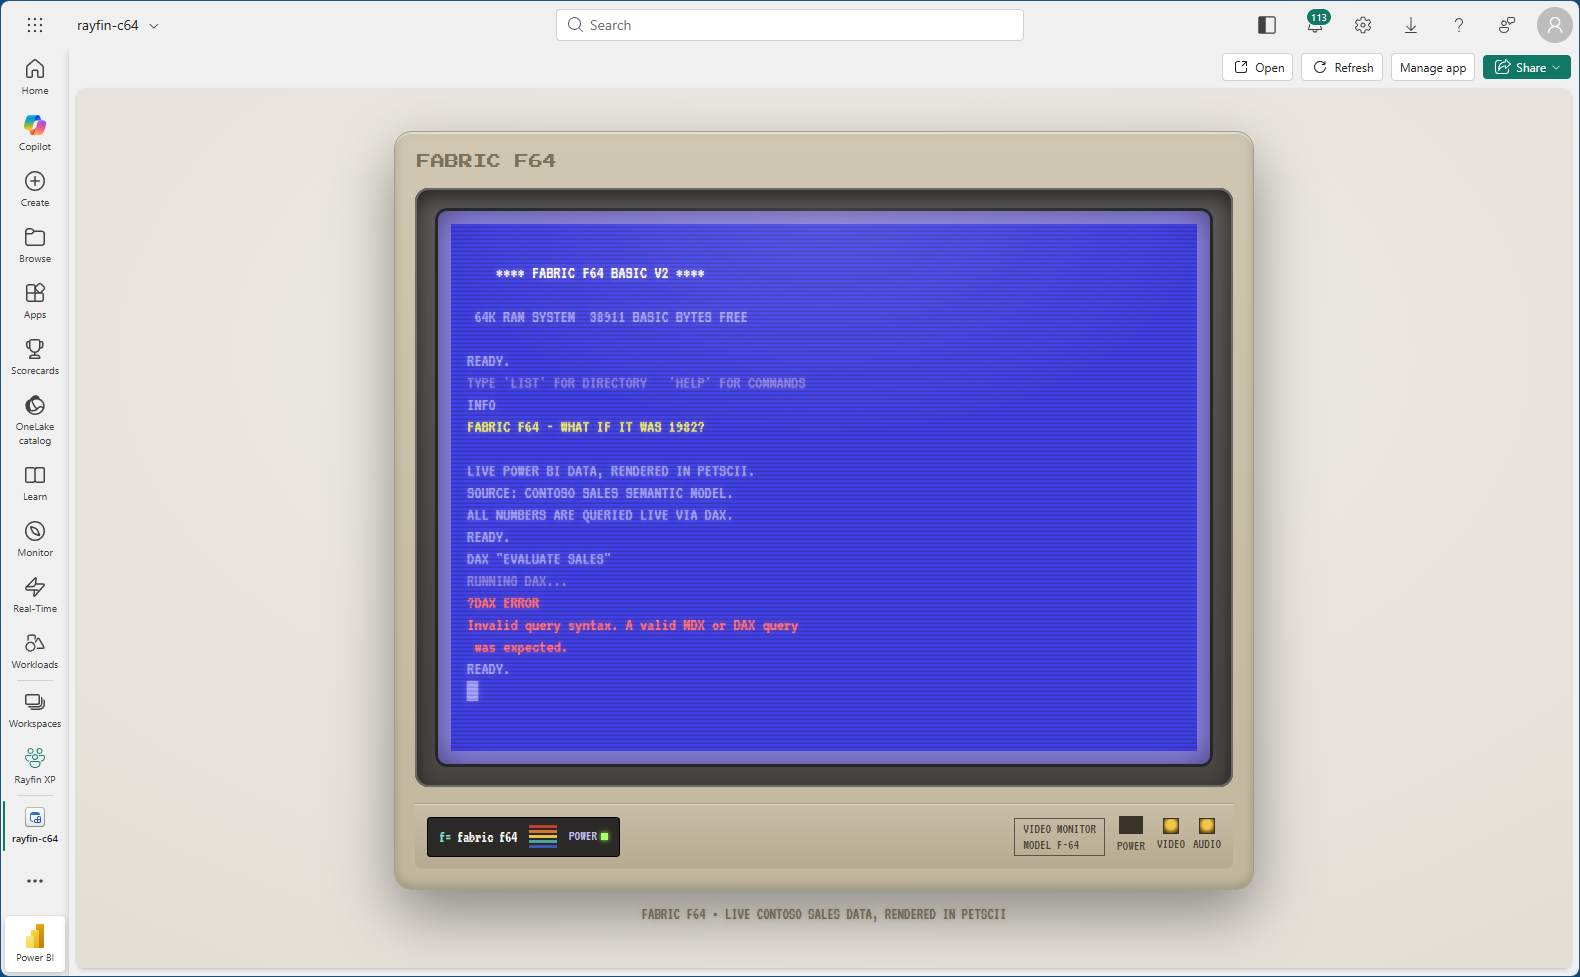
Fabric F64 — Power BI, reimagined as a Commodore 64
What if Power BI had shipped in 1982?
Fabric F64 is a Microsoft Fabric analytics app that renders live Power BI data as if it were running on a Commodore 64 — a blue PETSCII screen inside a beige retro CRT monitor, driven entirely by a BASIC-style command prompt.
You boot to a READY. prompt and LIST a virtual floppy of reports, then LOAD”NAME”,8 and RUN them. Each one draws itself in authentic 40-column text mode: KPIs as oversized numerals, bar charts built from block glyphs (█▉▊▌), a sparkline revenue trend, and PETSCII data grids. Every number is queried live via DAX against a Contoso Sales semantic model — no mock data anywhere.
The headline feature is a DAX REPL on the command line: you can write DAX like a BASIC program — inline (DAX EVALUATE …) or in a multi-line editor — and results print straight to the screen as a formatted text table.
It’s loaded with period-correct details: a CRT scanline/glow/flicker treatment, a Datasette-style PRESS PLAY ON TAPE loader with flashing color stripes, the legendary POKE 53280/53281 commands that recolor the border and screen in real time, and the classic 10 PRINT CHR$(205.5+RND(1)) maze.
Stack: React 19 · TypeScript · Vite · Tailwind CSS v4 · Microsoft Fabric (@microsoft/fabric-app-data for live DAX, Rayfin for embedded auth) · hand-rolled PETSCII rendering (no chart library). Deployed to the Fabric portal.